

Anybody who has played fantasy football through ESPN.com knows about Hector the Projector and Victor the Predictor: the two fictional characters who represent the quantitative and qualitative factors that go into ESPN’s weekly fantasy football projections. It’s common knowledge that the projections are, for the most part, wildly inaccurate. This year my team’s projections were particularly bad, so I decided to take a look at how much you can actually trust Hector and Victor (H&V).
To do the analysis, I gathered all the projected points and actual points from players on rosters for weeks 1-14 in my 10-person, head-to-head league. Our scoring system is very close to ESPN’s default settings, and the league is very competitive. In fact, ESPN ranked our league in the top 10 percent of leagues last year in overall PF. While studying the number of points from my league is a kind of proxy variable to ESPN’s yardage and touchdown projections that determine points, it’s a good indicator of problems with the system, as you will see. Also, limiting the cases studied to actual rosters ensures that the numbers are not skewed by third and fourth string players who clearly wouldn’t be doing anything in a given week.
Problems with Hector and Victor Projections
The obvious place to start is with the difference between projected H&V points and actual points, or how “off” all of the projections were.
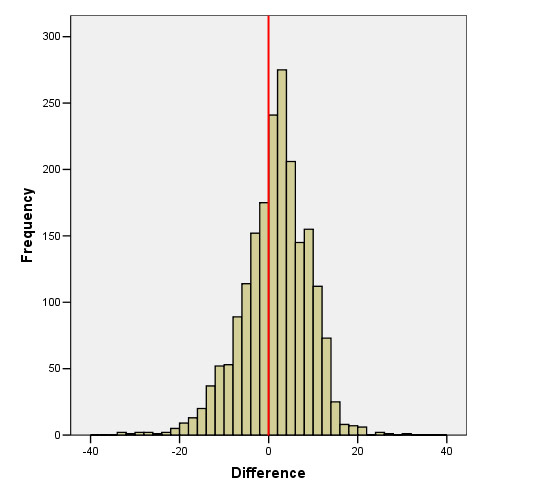
Going left or right from the zero marker, you can see how many points off each projection was. Take a look at the shape of the bell curve. You can immediately see that the distribution of the differences is skewed to the left, meaning that ESPN’s projections are, more often than not, higher than the actual point returns. The median of the distribution is 2, which means that, on the whole, a given player has an inflated projection by about two points each week, which works out to an inflation of 16 points per week for an active roster of 8 players. This is certainly not very earth shattering, as everybody knows their projections tend to be higher than the points you earn. More interesting is the plot of H&V projections to actual points:
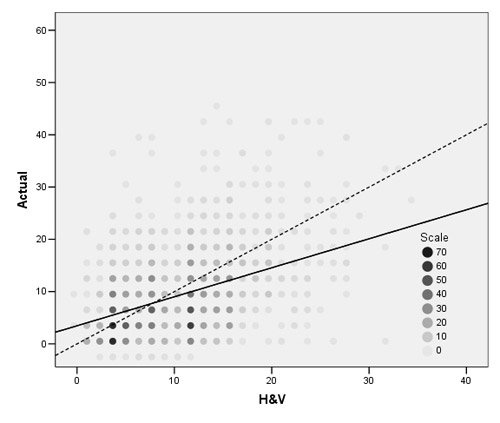
You can see right away that the plot is all over the place. The solid line plotted is the linear regression of all the data points. The equation for that line is y = 0.555x + 3.469. Compare the solid line to the dashed line, which is the equation y = x, which would be the expected regression line of the projections were, on average, in line with actual point values. Seeing the two lines and the distribution of pairs is interesting for gauging how inaccurate the projections are, but they don’t tell us much about each projection’s actual predictive value.
However, looking at the standard deviation of how “off” all the projections in the bell curve above were does give some insight into the predictive value of an individual projection. For all players on rosters for the 14 weeks, the standard deviation for how “off” the projections were was 7.5 points.
This means that you can predict with 68% confidence that a player will earn you a point value that is +/- 7.5 points from the projected value. So, if a player is projected to get 15 points, you can be 68% certain that it will be somewhere between 8 and 22 points. Similarly, you can be 95% certain that the same player will score between 0 and 30 points. You can see where I am going with this. The projections aren’t particularly accurate.
When you break out the standard deviations by position, here is how they differ:
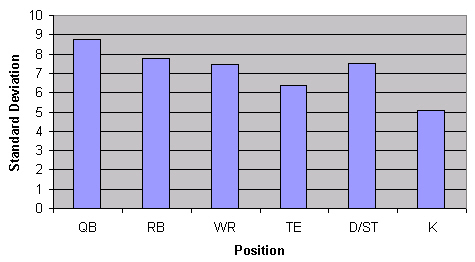
That yields these confidence intervals for each position:
| Position | St. Dev | 68% Confidence | 95% Confidence |
| QB | 8.7 | +/- 8.7 | +/- 17.4 |
| RB | 7.8 | +/- 7.8 | +/- 15.6 |
| WR | 7.4 | +/- 7.4 | +/- 14.8 |
| TE | 6.4 | +/- 6.4 | +/- 12.8 |
| D/ST | 7.5 | +/- 7.5 | +/- 15.0 |
| K | 5.1 | +/- 5.1 | +/- 10.2 |
Think about an estimate for each of the positions, look at the confidence intervals, and you can see how bad Hector and Victor are at their predictions. The differences between the standard deviations for each of the positions can be explained in large part due to the fact that the higher scoring positions are subject to more variation in projection vs. actual points. That doesn’t explain everything, though. For example, the standard deviation for TE projection and actual point differences really speak to the erratic nature of tight ends and the fact that ESPN hands out TD projections to them like candy. Guess what I’d never put money on Randy McMichael scoring a touchdown in any given week.
Similarly, take a look at how the standard deviations for how far “off” the scores are from projections week-to-week.
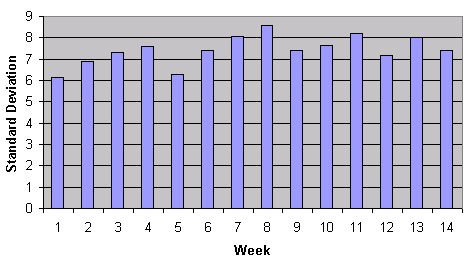
Look at the disparity in weeks 1-6 vs. 7-14. The projections are much further from accurate in the second half of the season, possibly due to injuries.
The most telling disaggregation, though, is the how standard deviation increases as projections increase:
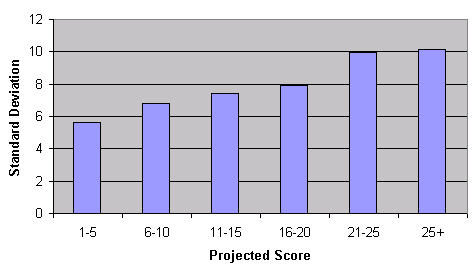
The higher the projections go, the more inaccurate they become. Each week ESPN predicts too many players having big games, and it creates a lot of outlandish predictions. Far too often mediocre backs and receivers are slated for a touchdown that does not happen.
The Effect on Game Lines
One of the most entertaining features of ESPN Fantasy Football is the matchup tool, which calculates a game line every week between each of the teams playing. The problem is that the game line is created directly from H&V projections, which tend to be very inaccurate.
To examine how effective ESPN is in projecting games, I compared the line of each home team and their actual margin of victory or loss for weeks 1-14 in my league and got this:
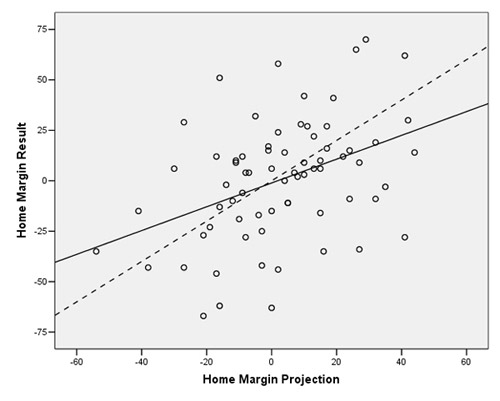
As you can see, the points are spread out almost as much as the previous plot. Again, the solid line is the linear regression, and the dotted line is y=x, the expected 1-to-1 regression.
I was actually more interested in seeing how accurate ESPN was in predicting the winner of a game, regardless of the margin. Excluding the three games in my league that it projected as ties, Hector and Victor correctly predicted 66% of games. This was actually surprising for me personally because ESPN incorrectly predicted half of my games this season.
An interesting pattern emerges when you look at ESPN’s game predicting accuracy by it’s predicted margin of victory:
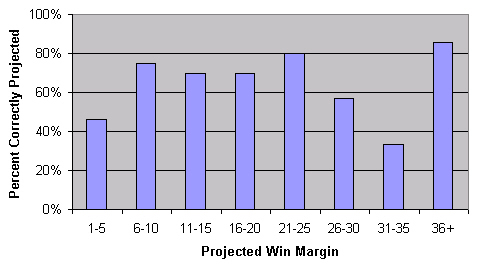
It seems that as you move from margins of 1 to 25 points, ESPN’s predicting accuracy increases. As you go from 26-35 margins of victory, it decreases significantly. But, huge margins (36+ points) tend to be very accurate. The 1-25 and 36+ tiers seem pretty intuitive: the larger the projected margin, the greater your likelihood of victory. So, why the dip from 26-35? I would argue that it’s those tiers that have too many players in games that have been given projections that are too high, thus creating upsets. But then why is the 36+ tier so strong? Those are probably the games where a very strong team is taking on a weaker one, and victory is almost a forgone conclusion. The trend is interesting, but view these numbers with some skepticism. We’re only talking about 67 data points here.
How to Improve Projections
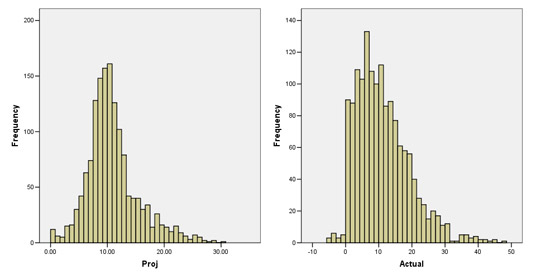
What good would this be if I didn’t actually offer a suggestion for fixing the problem? Projections are too high because ESPN is much too liberal in predicting players’ yardage and in assigning touchdowns. Here’s the proof:
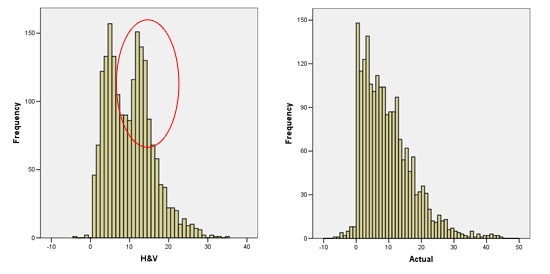
The first chart is the distribution of H&V projected scores for all players on rosters in weeks 1-14 in our league. The second is the actual amount of points earned. The spike in H&V projections on the right side of the distribution shows that mediocre players are projected too many yards and touchdowns. In fact, over the 14 weeks, there were 2,133 more points projected than actually earned. That works out to about 15 points per team per week.
Instead of having the inflated scores, ESPN should calculate the average number of touchdowns and yards per week and distribute only those quantities many among the players for their projections. The Hector and Victor team would need to make hard choices about who would actually make a touchdown and who would not, but in the end the projections would be much closer to accurate. Yahoo seems to have a system that does something close to this.
Comparison to Yahoo FFL Stats
I wanted to compare to Yahoo’s fantasy football system to see if they have similar problems with their projections. The problem with making the comparison between the two leagues is that I could only get data in the yahoo league for starters — not the benches, which I could get from ESPN. That doesn’t mean that the comparison is meaningless, though. Take a look at the difference between the projected and actual point values in my Yahoo league:
The shape of these two curves is very similar, indicating that Yahoo isn’t giving out too many points in their projections, like ESPN does. That turns out to be true. When my Yahoo numbers are weighted for comparison, ESPN gave away four times as many points as my Yahoo league did. Yes, the point systems are slightly different between the two leagues, but there is definitely something to be said for ESPN projecting four times as many points.
The standard deviation for how “off” the Yahoo predictions were, was 7.3. That’s lower than ESPN, but not by much (recall that ESPN was 7.5). However — that 7.3 number is just for those players who started in my Yahoo league. Recall also that starters have higher standard deviations than those players who sit on the bench. I did some estimating and think that I can reasonably put Yahoo’s standard deviation under 6.5 when bench players are factored in.
If ESPN limited their projections even further than Yahoo does, their accuracy would increase significantly moving forward.
Download My Data [Excel, 2.6 MB]